
Graph api is clearly the future for Microsoft toolkits, but it can be confusing to find the endpoints (urls) and examples for given tasks. In this post we will learn how to “reverse engineer” a graph command by clicking buttons/navigating a web page.
Intro
Microsoft Graph exposes REST APIs for almost all of Microsoft products. All graph apis start with the single endpoint https://graph.microsoft.com. You can create long urls to request, update, or publish information to Azure or Intune. There is extensive graph api documentation online, but sometimes, it can be difficult to find the exact urls/commands are needed to replicate a task that you know you can do in the web browser. By using the dev console, you can find out what graph apis the web apps are using.
Using the Dev Console
In most browsers, you can launch a dev console that shows source code, network stats, and other advanced info about a web page. The dev console will be useful to us by showing what graph url a page in Intune is calling.
- Launch the dev console
- Navigating menus you can do Browser Menu > More Tools > Developer Tools
- Most browsers you can hit the f12 key and launch the console
- Open the network tab
- Along the top of the dev console, you will see tab. Find the tab called network. It will have a wifi like logo.

- Once you open the network tab, it will start in a recording mode. Navigating to another page or clicking a button will generate a row for the associated network call that the web page made.
 Pages can make a lot of calls so it is best to start and stop the recording to capture only actions you are trying to investigate. To stop a recording press the red square surrounded by a circle. To clear a recording click the circle with a diagonal line through it.
- Along the top of the dev console, you will see tab. Find the tab called network. It will have a wifi like logo.
- As a basic example, lets navigate to the Intune page for windows devices. Click away to the monitor tab for a moment. In the dev console, clear an existing network captures with the cancel button; then, begin recording. Now, click the Windows devices tab again. After the page loads, stop the capture.
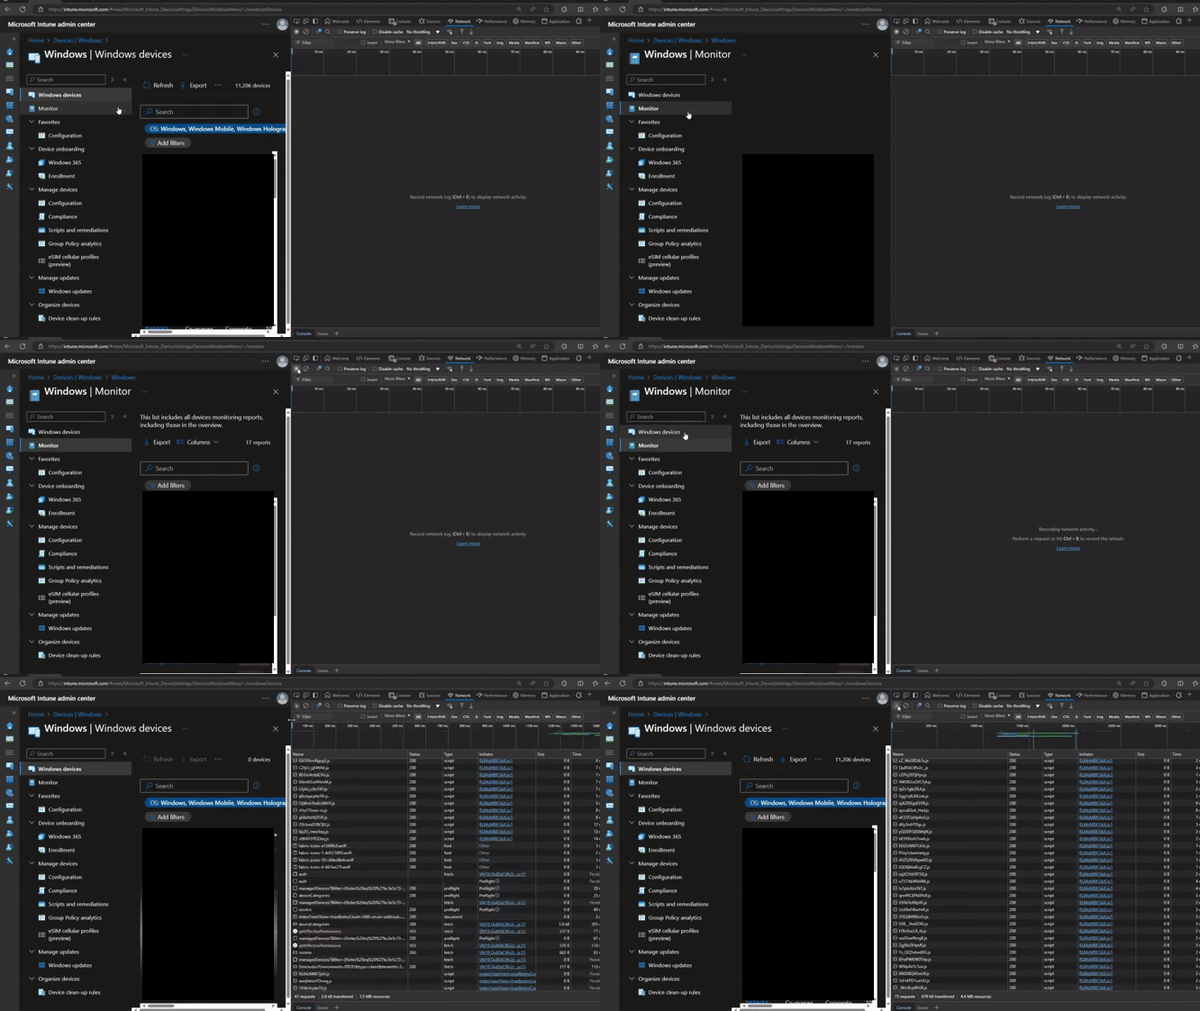
In the Dev Console, you will see several rows of network traffic. We only need to investigate the ones with the type fetch, and we can ignore scripts, fonts, etc. In my capture, there are 3 rows with names managedDevices,deviceCategories, and managedDevices. These are the ones that we need to investigate. I will click on the one of the “managedDevice” entries and look at the request headers.
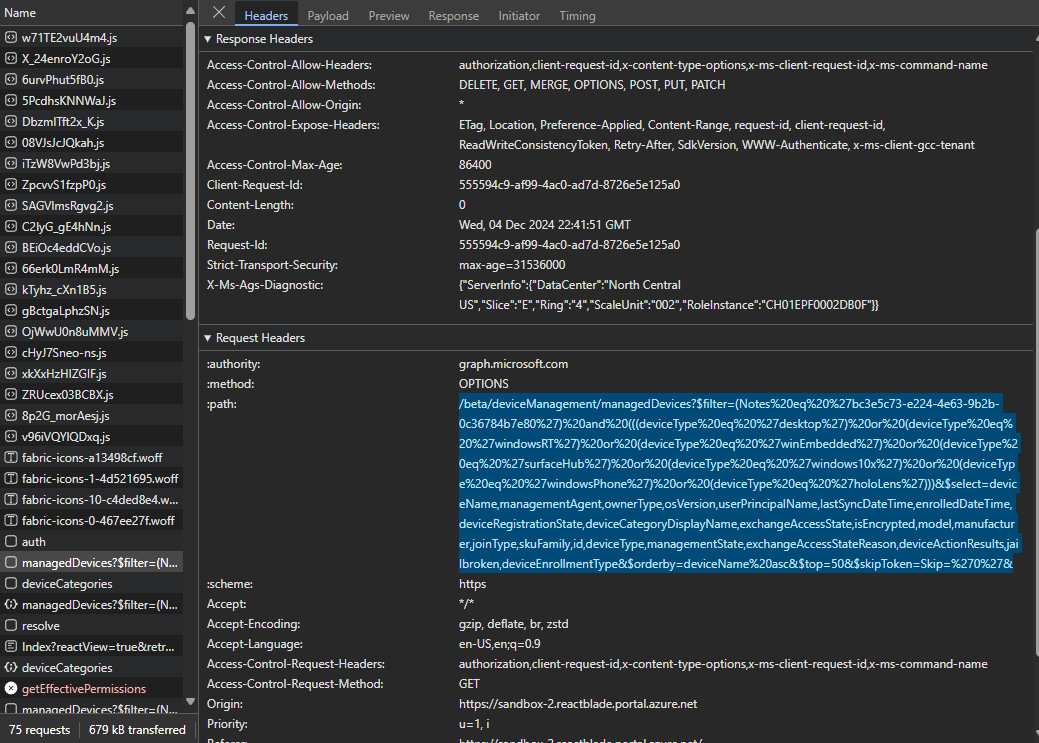
In the image, I have highlighted a path attribute, but you can also look at the request url attribute. This url is really long, but let’s break it down into parts. A Graph api has 5 major parts
{HTTP method} https://graph.microsoft.com/{version}/{resource}?{query-parameters}
-
HTTP method
This can be Get, Post, Patch, Put, or Delete. Get and Post don’t require a request body, but the other 3 generally have a request body in JSON format included with the request
-
Version
/betaAt the time of writing, MS graph only has v1.0 and beta. Beta api’s can have breaking changes made to them with little or no notice but are often needed for some new features. They may cause your app/script to suddenly break one day, so integrate them into an app/workflow at your own risk. -
Resource
/deviceManagement/managedDevicesThe Resource is what you are interacting with. In this case, it is “managed devices”, but it could be a a user or a user’s messages/me/messages -
Query Parameters
?$filter=Every thing after the ? are ODATA system queries. These queries can filter the objects that are returned, including more or less attributes (for a computer think Name, serial, ownership type, architecture, etc)(Notes%20eq%20%27bc3e5c73-e224-4e63-9b2b-0c36784b7e80%27)%20and%20 (((deviceType%20eq%20%27desktop%27)%20or%20(deviceType%20eq%20%27windowsRT%27)%20or%20(deviceType%20eq%20%27winEmbedded%27)%20or%20(deviceType%20eq%20%27surfaceHub%27)%20or%20(deviceType%20eq%20%27windows10x%27)%20or%20(deviceType%20eq%20%27windowsPhone%27)%20or%20(deviceType%20eq%20%27holoLens%27)))The block had a Notes section. I believe this is retrieving the notes property equal to a guid. This blog article talks more about Notes.
The rest of the filter block is filter for OS types that are Windows. You will see windowsRT, SurfaceHub, WindowsPhone, holoLens, windows 10, and others. It is funny to me that all of those devices are considered Windows and don’t have their own category.
&$select=deviceName,managementAgent,ownerType,osVersion,userPrincipalName,lastSyncDateTime,enrolledDateTime,deviceRegistrationState,deviceCategoryDisplayName,exchangeAccessState,isEncrypted,model,manufacturer,joinType,skuFamily,id,deviceType,managementState,exchangeAccessStateReason,deviceActionResults,jailbroken,deviceEnrollmentTypeThis block is selecting the fields to return with the query. If you left these off your request, you would just get the default fields.
&$orderby=deviceName%20asc&$top=50&$skipToken=Skip=%270%27&This final block orders the return request by device name, only returns the first 50 devices, and a skip token. A skip token would be used for additional requests. If you wanted to get a lot of devices, break the request into smaller batches.
-
Headers
Our example didn’t have any headers, but some APIs will require headers. Headers are generally (if not always) json formatted information. You will always have authorization bear token in your request so that graph knows you have permissions to access what you request. Most apps/commands will automatically include your authorization headers. Some apis will require addition information. I will not get into those for this introduction.
Graph Explorer
Now that we have all that information for a query, we can use graph explorer for testing/exploring the api. It is a website create by Microsoft where you can try queries against a test tenant or your production environment.
If you paste the request url we got before into the box on graph explorer, we can run a query. Make sure you log into the correct tenant.

After you pasted in your query, click the “run query” button. The Version dropdown should adjust to v1.0 or beta automatically, but you will have to adjust your http method. For my example, the default “GET” is correct. Hopefully, you get an OK response and can scroll down to see the content of the response. It should be some request information followed by a list of devices and attributes in JSON format.
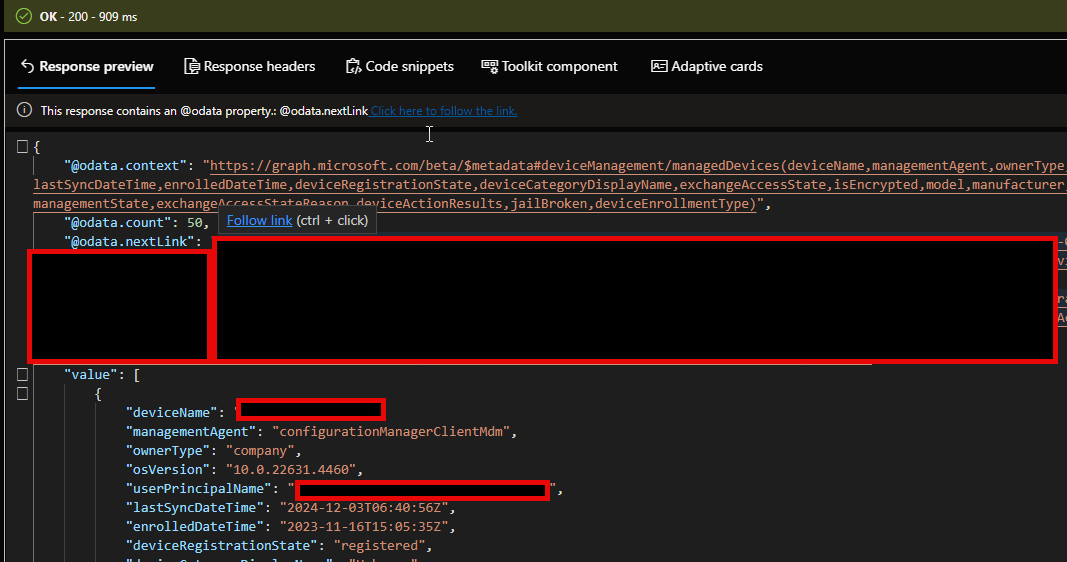
In my example I can see:
- odata.context attribute that has the Resource path we used as well as the selected fields
- odata.count = 50, since we limited our request to the first 50 devices this makes sense
- odata.nextLink, If you paste this link in to a graph explorer request, you will get the next 50 devices.
- value contains the 50 devices and the selected attributes.
Graph X-ray
Graph Xray is a extension/app made by Merill Fernando and others that is like a Fiddler for Microsoft’s graph api. It trivializes the process that we went through above. It will convert the graph commands to several languages.
- Install X-ray for your browser. Currently, it only supports chrome and edge.
- Launch the Dev Console by typing f12. In the window, look along the top for a “+” button. Click it, and select Graph X-ray. If you don’t see it, you may have already added the tool. Look for a puzzle piece in your menu bar and select graph X-Ray.

-
Select a language to translate calls into. For my example, I will use Powershell because it is what I am the most familiar with.
-
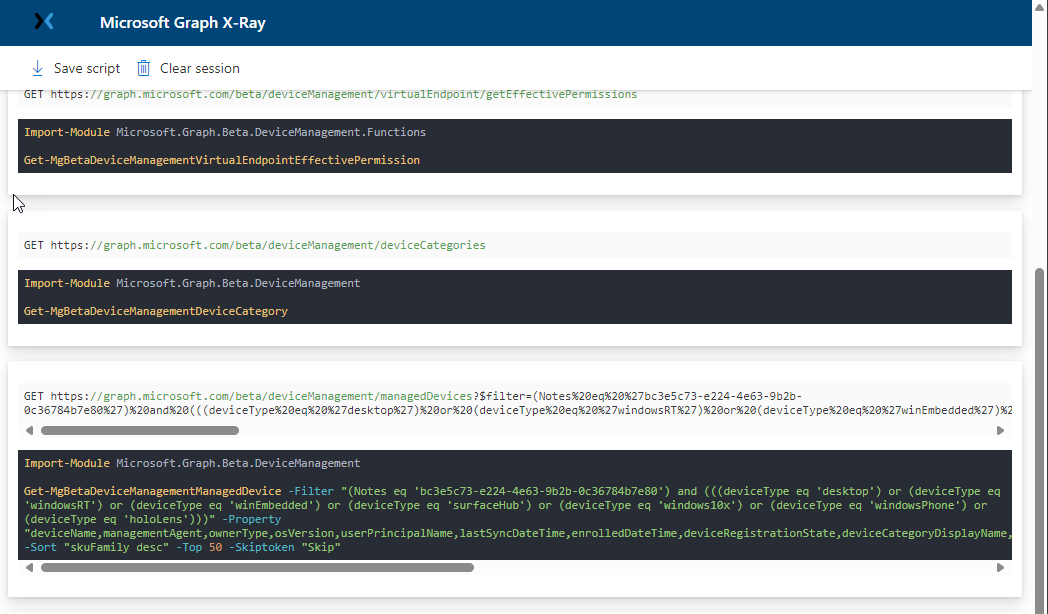
Now, navigate to the Windows devices page again, and you will see code generated on the right.
-
Now, you can copy that code in to your Powershell ISE of choice. You just need to add the
Connect-Graphcommand to the top and make sure any modules are installed.
Connect-Graph

Import-Module Microsoft.Graph.Beta.DeviceManagement

Get-MgBetaDeviceManagementManagedDevice -Filter "(Notes eq 'bc3e5c73-e224-4e63-9b2b-0c36784b7e80') and (((deviceType eq 'desktop') or (deviceType eq 'windowsRT') or (deviceType eq 'winEmbedded') or (deviceType eq 'surfaceHub') or (deviceType eq 'windows10x') or (deviceType eq 'windowsPhone') or (deviceType eq 'holoLens')))" -Property "deviceName,managementAgent,ownerType,osVersion,userPrincipalName,lastSyncDateTime,enrolledDateTime,deviceRegistrationState,deviceCategoryDisplayName,exchangeAccessState,isEncrypted,model,manufacturer,joinType,skuFamily,id,deviceType,managementState,exchangeAccessStateReason,deviceActionResults,jailbroken,deviceEnrollmentType" -Sort "skuFamily desc" -Top 50 -Skiptoken "Skip"
After running this command, I got an error that there was no “skiptoken” property on the cmdlet. I checked the docs for Get-MgBetaDeviceManagementManagedDevice and indeed found not skip token property. I removed that part of the command and ran it again.

After running the command again, I got a table with 50 computers! If you get a permission error, you need to log into Azure and grant the enterprise app Microsoft Graph Command Line Tools permissions to your user or the entire company.
Conclusion
I hope this article was helpful for those new to graph. It felt a little overwhelming to me compared to the old microsoft cmdlets.